Close
Close
 31st October 2023
Social Class and Inequality
Social class is a way of classifying people into groups based on their income, education, occupation and influence. Historically, class in the UK has been divided into ‘upper class’, ‘middle class’ and ‘working class’. It is recognised, however, that traditional ways of dividing social class may be less relevant in current society.
In 2013, the results of the Great British class survey were published. This survey, conducted in 2011, found that social class could be understood in seven distinct groups. These were: elite, established middle class, technical middle class, new affluent workers, traditional working class, emergent service sector, and precariat. As well as looking at income and educational attainment, these classes take into account political beliefs and cultural engagement.
Overview of the Great British Class Survey 2011:
| Class | Features |
|---|---|
| Elite | Represent 6% of British society. High economic capital and high-brow cultural capital. Primarily located within London and the Home Counties. High proportion of graduates from Oxbridge. |
| Established Middle Class | Represent 25% of British society. High economic capital and high-brow and emerging cultural capital. High proportion of graduates into managerial and professional jobs. Even geographically spread throughout the UK. Typical careers: occupational therapists, police constables, town planners. |
| Technical Middle Class | Represent 6% of British society. High economic capital with moderate cultural capital and low social contacts. Typical careers: medical radiographers, senior administrative and research positions. Higher proportion living in the South East of England. |
| New Affluent Workers | Represents 15% of British society. Moderate economic capital, moderate high-brow capital, good emerging capital. Typical careers: electricians, postal workers and plumbers. Fewer attended university. Family background tends to be non-middle class. |
| Traditional Working Class | Represents 14% of British society. Relatively poor economic capital but some housing assets. Low cultural capital. Typical careers: care workers, cleaners and electricians (again). Many live in previous industrial areas of Britain. University graduates are more likely to attend as mature students or part time. |
| Emergent Service Sector | Represents 19% of British society. Relatively poor economic capital but reasonable household income. Good emerging social capital but poor high-brow social capital. Generally younger age group, with work in bars, chefs, and care assistants. Located in central London and university towns. |
| Precariat | Represents 15% of British society. Low economic and social capital. Low and unstable income due to ‘gig-economy’ and short term contracts. Often living in old industrial parts of Britain. |
Socioeconomic status
Social class and socioeconomic status are often used interchangeably; however, this is not technically correct. Socio-economic status is a person’s access to financial or social resources in relation to others. Rather than being neatly divided into discrete groups, socioeconomic status can be viewed as a spectrum of ‘high’, ‘middle’ and ‘low’. It is more changeable than social class throughout a person’s lifetime and can be impacted by sudden variations in income or health.
Social causation theory
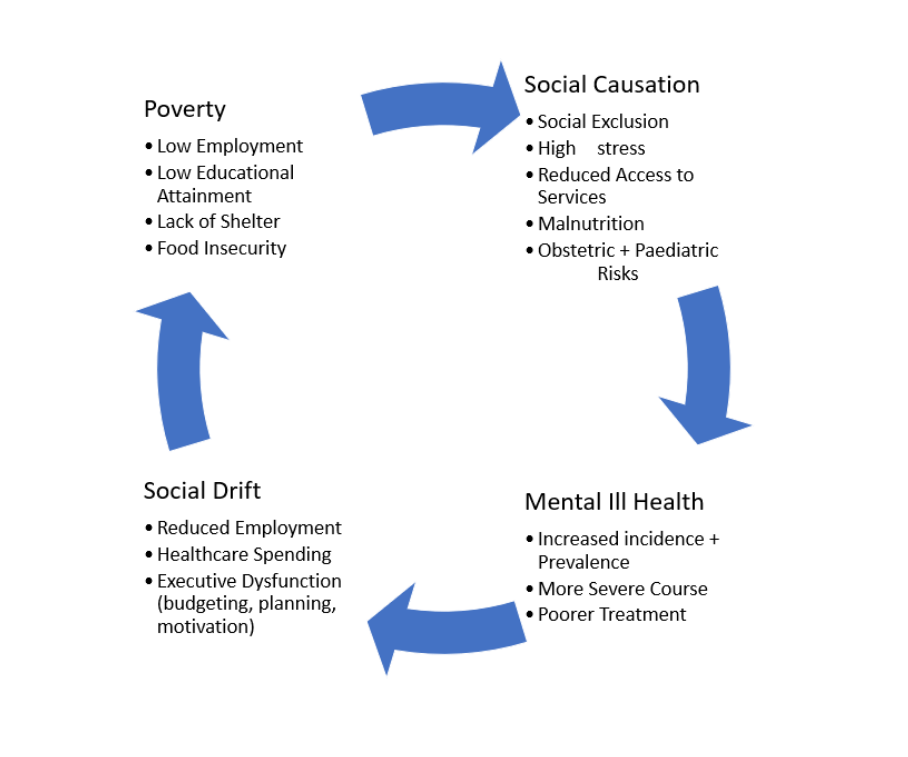
The social causation theory posits that poverty and inequality within society increases the risk of mental illness in people already vulnerable. For example, difficulties faced by people of minority ethnic groups, gender inequality and classism can cause stress that can ‘tip’ people into mental illness (see also the stress vulnerability model). Other relevant factors to the social causation theory of mental illness is the increased rates of social exclusion, isolation, malnutrition and obstetric complications seen in people of lower socioeconomic status.
Consider also the traditional barriers to accessing healthcare that affect people in poverty: unable to afford time off work to see a general practitioner or unable to afford transport to them. The inverse care law was proposed by Julian Tudor Hart in 1971 and explains that good healthcare availability varies inversely with a population’s needs. All the above factors can impact mental health as well as physical health.
It’s also important to consider that people experiencing poverty are less able to access protective factors, such as a supportive social network and enriching activities like exercise.
The above can be understood through Myers’ ‘life-course’ model (1975), which explains the higher levels of mental illness among people with the lowest socioeconomic status. He suggests poorer people consistently encounter greater social problems during their lives, but they do not have access to the educational, social and economic resources that would help them to overcome these problems. This accumulation of stress can tip a person into mental illnesses such as depression.
Social drift theory
As well as the propensity for poverty to negatively impact mental health, people with mental illness can drift into or remain in poverty. Known as the social drift theory, this can be due to increased spending on healthcare, reduced productivity, loss of employment, isolation and stigma.
In their 1963 study ‘Schizophrenia and Social Class’, Goldberg and Morrison looked at the social class of men aged 25-34 admitted to hospital with a first episode of schizophrenia. They found that the study subjects over-represented the lowest social classes. When they compared this to the occupation of the men’s father (which was in line with the general population), they found that there was a significant drop in social class between father and son. They hypothesised that the decline in social class was due to the impact of the men’s developing mental illness.
Urbanicity
People living in cities are at greater risk of developing mental illness than their rural counterparts. Results from a Swedish population study show that the risk of developing a psychotic illness is 66-77% in the most urban areas compared to the most rural areas (Sundquist et al. 2004). The increase in risk for depression is 12-20%. It also seems that the longer a person spends growing up in urban areas, the more their risk is increased. This shows that there is a ‘dose-response’ relationship.
The reasons for this finding are similar to those mentioned above. There is a higher level of inequality and discrimination in cities. Specific factors such as air pollution and lack of access to green space can also be a factor. Growing up in more deprived urban areas can also mean being exposed to gang violence, other physical threats, and easier access to street drugs.
References
- Devine, F. and Snee, H. (2015) ‘Doing the great british class survey’, The Sociological Review, 63(2), pp. 240–258. doi:10.1111/1467-954x.12282.
- Goldberg, E.M. and Morrison, S.L. (1963) ‘Schizophrenia and social class’, British Journal of Psychiatry, 109(463), pp. 785–802. doi:10.1192/bjp.109.463.785.
- Lund, C. et al. (2011) ‘Poverty and mental disorders: Breaking the cycle in low-income and middle-income countries’, The Lancet, 378(9801), pp. 1502–1514. doi:10.1016/s0140-6736(11)60754-x.
- Myers, Jerome K., et al. “Life Events, Social Integration and Psychiatric Symptomatology.” Journal of Health and Social Behavior, vol. 16, no. 4, 1975, pp. 421–27. JSTOR, https://doi.org/10.2307/2136613. Accessed 21 May 2023.
- Sundquist, K., Frank, G. and Sundquist, J. (2004) ‘Urbanisation and incidence of psychosis and depression’, British Journal of Psychiatry, 184(4), pp. 293–298. doi:10.1192/bjp.184.4.293.
Complete Guide to Clinical Genetics ST3 Application and Recruitment (2027)
Written by Medibuddy. Last updated: October 2026. Clinical Genetics is

Complete Guide to Clinical Radiology ST3 Application and Recruitment (2027)
Recruitment paused: NHS England is not running Clinical Radiology ST3+ recru

Complete Guide to Paediatric Surgery ST3 Application and Recruitment in United Kingdom (2026)
Written by Medibuddy. Last updated: October 2026. If you’re planning

Take your subscriptions with you
Our mobile app allows you to access your interview and exam question banks wherever you are.