Close
Close
 7th February 2024
Cardiovascular Physiology
Cardiac Electrophysiology
There are four chambers of the heart. The function of the heart is reliant on the coordinated contraction of heart chambers. This coordination is via the cardiac conduction pathway.
Cardiac conduction starts with pacemaker cells. Cardiac pacemaker cells are specialised cells. They undergo spontaneous depolarisation (automaticity) regularly (rhythmicity). They are found in the sinoatrial (SA) nodes, atrioventricular (AV) nodes, bundle of His, and ventricles. They have different rates of spontaneous depolarisation, with the SA node having the fastest (70 times per minute) and ventricular pacemaker cells having the slowest (40 times per minute).
Generation of pacemaker action potential
The electrophysiology of action potential generation of cardiac pacemaker cells follows a cycle:
Following an action potential, the pacemaker cell returns to a resting membrane potential of -60mV
- Phase 4: Increasing membrane permeability to sodium ions causes slow leakage of sodium ions via sodium channels into the cell, causing membrane potential to become less negative. This results in spontaneous depolarisation of the pacemaker cells.
- This is referred to as the funny current, If. The funny current is found in cardiac areas supporting spontaneous depolarisation, including the sinoatrial node, atrioventricular node and Purkinje fibres.
- Phase 0: When the membrane potential reaches a threshold potential of -40mV, voltage-gated T-type calcium channels open, and rapid Ca2+ influx into the cell occurs, causing depolarisation to the membrane potential of +20mV (Phase 0)
- Phase 3: Following depolarisation, the voltage-gated T-type calcium channels close. Voltage-gated potassium channels open, causing efflux of K+ from the cell, returning membrane potential to resting potential of -60mV (Phase 3).
 Image Source: Wikimedia Commons (2010). Pacemaker potential annotated, Licensed under a creative commons licence. Available for free at: https://upload.wikimedia.org/wikipedia/commons/8/81/Pacemaker_potential_annotated.gif (Accessed: 4 January 2024).
Conduction of electrical signals of cardiac myocytes
- Phase 0: Action potentials from pacemaker cells or nearby myocytes induce transient opening of Na+ channels, resulting in an influx of Na+ into myocytes. This produces rapid depolarisation to the membrane potential of +20mV
- Phase 1: Immediately following phase 0, Na+ channels close in response to depolarisation, voltage-gated K+ channel transiently opens, and electrochemical gradient causes transient efflux of K+ ions.
- Phase 2: Membrane potential is stable at this phase. Inward and outward currents are balanced. K+ channels remain open. L-type Ca2+ channels open. This results in the influx of Ca2+ ions, balanced by the efflux of K+ ions. The influx of Ca2+ ions initiates the release of intracellular Ca2+ stores in excitation-contraction coupling (see later).
- Phase 3: Repolarisation begins due to the closing of L-type Ca2+ channels. K+ channels remain open, resulting in the outward flow of K+.
- Phase 4: Membrane potential is maintained at resting membrane potential at -85mV. This phase also allows an interval between action potentials to return Ca2+ into intracellular stores.
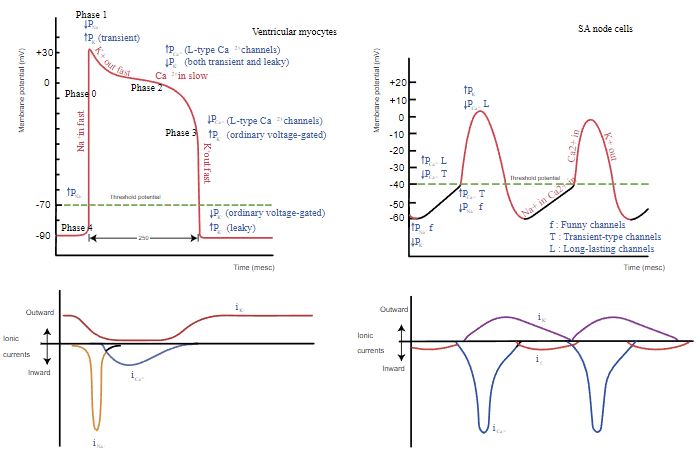
Image Source: Wikimedia Commons (2019). Heart rhythm ionic flow, Licensed under a creative commons licence. Available for free at: https://upload.wikimedia.org/wikipedia/commons/b/bc/Heart_rhythm_ionic_flow.svg (Accessed: 4 January 2024).
References
Oberman, R., Shumway, K. R., & Bhardwaj, A. (2023). Physiology, Cardiac. In StatPearls. StatPearls Publishing. http://www.ncbi.nlm.nih.gov/books/NBK526089/
Cardiac cycle
Summary
A cardiac cycle describes all physiological events in the heart in a heartbeat. It broadly consists of two periods – systole and diastole.
In our discussion of the cardiac cycle, it is helpful to correlate the following:
- ECG (overall electrical events of the heart)
- Volume changes in different heart chambers
- Pressure changes in different heart chambers, vena cava (jugular venous pressure, JVP), and aorta
- Heart sounds
The cardiac cycle can be subdivided into five discrete phases:
- Atrial contraction
- Isovolumetric ventricular contraction
- Ventricular ejection
- Isovolumetric ventricular relaxation
- Passive ventricular filling
Atrial contraction
- The mitral valve and tricuspid valve open due to passive ventricular filling.
- The sinoatrial node depolarises spontaneously, and action potential is transmitted throughout the atria. (p wave on ECG)
- Atrial contraction produces an ‘atrial kick’. This is responsible for 10% of ventricular filling. The pressure generated during atrial contraction causes an increase in JVP (represented by a wave on the JVP waveform), which also causes an increase in ventricular pressure.
- The blood volume in the ventricle at the end of atrial contraction is the end-diastolic volume.
Isovolumetric ventricular contraction
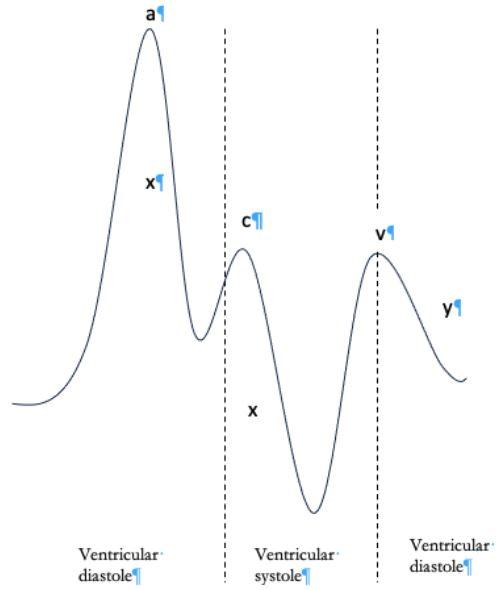
- As both atria relax, the pressures in the atria start to fall. This allows some passive filling of the right atrium, causing the x descent on the JVP waveform.
- The action potential travels through the atrioventricular node (AV node) via the bundle of His and Purkinje fibres into the ventricles. (QRS on ECG)
- Ventricular contraction results in a rapid rise in intraventricular pressure.
- When intraventricular pressure exceeds atrial pressure, mitral and tricuspid valves close. (First heart sound, S1). Aortic and pulmonary valves remain closed at this stage. Intraventricular volume remains the same.
- Contraction of the right ventricle against a closed tricuspid valve results in a transient rise in atrial pressure transmitted up the SVC, resulting in the c wave on the JVP waveform.
Ventricular ejection
- Intraventricular pressure continues to rise.
- When intraventricular pressure exceeds the pressure in the aortic and pulmonary arteries, aortic and pulmonary valves open, and blood is ejected.
- Initially, intraventricular pressure exceeds aortic pressure, and intraventricular volume and pressure decrease over time as blood in the ventricles is ejected.
- At the end of ventricular contraction, the contracted right ventricle means increased space in the pericardial sac. This allows the right atrium to fill with blood and drops the pressure within the SVC and IVC, producing the x’ descent on the JVP waveform.
- Ventricular myocytes start relaxing after the ejection of blood. Intraventricular pressure falls below the pressure in the aortic and pulmonary arteries, and the aortic and pulmonary valves close (Second heart sound, S2)
Isovolumetric ventricular relaxation
- After aortic and pulmonary valve closure, ventricular relaxation is short before intraventricular pressure falls below atrial pressure. Hence, mitral and tricuspid valves remain closed, and intraventricular volume remains the same.
- Since the late phase of ventricular ejection, there is ongoing venous return into the atria, and volume and pressure in the atrial rise slowly. (Correspond to v wave in JVP waveform)
Passive ventricular filling
- When atrial pressure exceeds ventricular pressure, the mitral and tricuspid valves open, and blood flows down the pressure gradient from the atria into the ventricles.
- The fall in atrial pressure corresponds to y-descent in the JVP waveform.

Image Source: Wikimedia Commons (2016). Wiggers Diagram 2, Licensed under a creative commons licence. Available for free at: https://upload.wikimedia.org/wikipedia/commons/9/91/Wiggers_Diagram_2.svg (Accessed: 4 January 2024).
References
Pollock, J. D., & Makaryus, A. N. (2023). Physiology, Cardiac Cycle. In StatPearls. StatPearls Publishing. http://www.ncbi.nlm.nih.gov/books/NBK459327/
Cardiac output
Summary
Cardiac output is the volume of blood ejected by the left or right ventricle per minute. It is dependent on stroke volume and heart rate.
Cardiac output = stroke volume x heart rate
The following describes how each factor affects cardiac output:
Preload
Preload refers to the degree to which the cardiac muscle fibres are stretched during the diastolic phase. Increased stretch in the cardiac myocytes will increase contractility up to a certain point. Beyond this, further increased stretch will reduce cardiac contractility. The Frank-Starling curve defines this law.
Upwards movement of the curve is seen when there is an overall positive inotropic effect, including exercise, increased sympathetic drive and digoxin. Downwards movement of the curve is seen in overall negative inotropic states, including beta-blockers, calcium channel blockers and cardiac failure.
 Cardiac contractility
Muscle contractility is seen as the force that the heart generates in a single heartbeat. Factors that affect this can be divided into positive or negative inotropes
- Positive inotropes:
- Catecholamines and the sympathetic nervous system
- Dopamine and isoproterenol. These stimulate the influx of calcium ions into myocytes
- Digoxin increases intracellular calcium ion levels by reducing calcium movement out of the cell.
- Hormones, including glucagon and thyroid hormones
- Negative inotropes
- Beta-blockers
- Calcium channel blockers
- Hypoxia
- Acidosis
- Cardiac failure.
Afterload
Afterload is the force resisting the contraction of cardiac myocytes. Mean arterial pressure and systemic vascular resistance reflect left ventricular afterload. Pulmonary vascular resistance is used to reflect right ventricular afterload. Factors that increase the systemic vascular resistance will increase afterload and reduce stroke volume.
Heart rate
The heart rate is usually affected by the autonomic nervous system and medications that affect heart rate directly ( e.g. bisoprolol and ivabradine). On the usual spectrum, an increase in heart rate will increase the cardiac output. Heart rate also impacts the heart’s ability to fill during diastole during extremely high heart rates, affecting stroke volume.
References
King, J., & Lowery, D. R. (2023). Physiology, Cardiac Output. In StatPearls. StatPearls Publishing. http://www.ncbi.nlm.nih.gov/books/NBK470455/
Vincent J. L. (2008). Understanding cardiac output. Critical care (London, England), 12(4), 174. https://doi.org/10.1186/cc6975
Coronary blood flow
Summary
Coronary arteries are end arteries which supply oxygenated blood to cardiac myocytes. Cardiac veins then remove deoxygenated blood from cardiac myocytes.
Coronary blood flow is around 200-250mL/min at rest.
Coronary blood flow in the left ventricle occurs only during systole. During ventricular systole, left ventricular pressure is higher than aortic pressure, compressing subendocardial coronary vessels in the left ventricle.
Coronary blood flow in the right ventricle continues throughout the cardiac cycle. Aortic pressure is greater than right ventricular pressure during ventricular systole and diastole.
Hence, the left ventricle is most at risk from ischaemia.
References
Rehman, S., Khan, A., & Rehman, A. (2023). Physiology, Coronary Circulation. In StatPearls. StatPearls Publishing. http://www.ncbi.nlm.nih.gov/books/NBK482413/
Regulation of blood pressure
Short-term control
Baroreceptors continuously monitor blood pressure. Baroreceptors are stretch receptors in blood vessel walls that respond to increased blood pressure. There are two baroreceptors in our body – high-pressure baroreceptors and low-pressure baroreceptors.
High-pressure baroreceptors are located within the carotid sinus and aortic arch. Low-pressure baroreceptors are located in the right atrium. High- and low-pressure baroreceptors send signals integrated into the medulla’s cardiovascular centre. The cardiovascular centre then sends appropriate responses via the autonomic nervous system – sympathetic or parasympathetic system. Stimulation of the sympathetic system will cause increased heart rate and peripheral vasoconstriction, leading to increased blood pressure. Stimulation of the parasympathetic system will cause a decrease in heart rate to reduce blood pressure.
Long-term control
Long-term control of blood pressure is primarily related to the regulation of blood volume. Blood volume is regulated by sodium and water reabsorption control, which is influenced by the renin-angiotensin-aldosterone system, antidiuretic hormone, and natriuretic peptides.
References
Shahoud, J. S., Sanvictores, T., & Aeddula, N. R. (2023). Physiology, Arterial Pressure Regulation. In StatPearls. StatPearls Publishing. http://www.ncbi.nlm.nih.gov/books/NBK538509/
Exercise physiology and exercise testing
Cardiovascular changes during exercise
During exercise, there is a marked increase in muscle metabolic rate, resulting in increased oxygen demand and the need for an increased rate of CO2 and metabolite clearance. Hence, our cardiovascular system needs to be able to mount a physiological response to meet these demands.
The cardiovascular system undergoes various physiological changes during exercise, and these include:
- Significant increase in cardiac output. At rest, cardiac output for an average individual is around 5L/min. During exercise, this can be increased up to 25L/min to meet the metabolic demand of exercising muscles. The sympathetic system mediates this increase in cardiac output.
- Stimulation of the sympathetic system increases heart rate and increase in myocardial contractility.
- Skeletal muscle activity results in vasoconstriction, increasing venous return, hence increasing preload. An increase in preload contributes to increased cardiac output.
- Skeletal muscle activity also produces metabolites that cause vasodilation, resulting in decreased systemic vascular resistance.
Other changes that occur during exercise include changes to regional blood flow. The most significant increase in blood flow is to the skeletal muscles. Blood flow to other organs is also affected during exercise. Changes include:
- Increase in coronary blood flow
- Increase in blood flow to the skin to aid heat dissipation
- Decrease in splanchnic blood flow
- Decrease in renal blood flow but to a lesser degree than splanchnic blood flow.
- Cerebral blood flow is maintained.
References
Patel, P. N., & Zwibel, H. (2023). Physiology, Exercise. In StatPearls. StatPearls Publishing. http://www.ncbi.nlm.nih.gov/books/NBK482280/
Complete Guide to Clinical Genetics ST3 Application and Recruitment (2027)
Written by Medibuddy. Last updated: October 2026. Clinical Genetics is

Complete Guide to Clinical Radiology ST3 Application and Recruitment (2027)
Recruitment paused: NHS England is not running Clinical Radiology ST3+ recru

Complete Guide to Paediatric Surgery ST3 Application and Recruitment in United Kingdom (2026)
Written by Medibuddy. Last updated: October 2026. If you’re planning

Take your subscriptions with you
Our mobile app allows you to access your interview and exam question banks wherever you are.