Close
Close
 7th February 2024
Respiratory Physiology
Function of the lung
Summary
Functions of the lung can be considered in terms of respiratory and non-respiratory functions.
The lung’s respiratory function involves exchanging oxygen and carbon dioxide. The lung’s respiratory function depends on ventilation, pulmonary circulation, diffusion of gases across the blood-gas barrier, and control mechanism of ventilation.
Non-respiratory function of the lung can be categorised into:
- Pulmonary circulation
- Reservoir of blood in haemorrhage (around 400-500mL an adult)
- Filters blood (removal of thrombi)
- Metabolic functions:
- Metabolism of vasoactive substances
- The site of activity is the pulmonary endothelium.
- Examples:
- Peptides (e.g. angiotensin I activated into angiotensin II, inactivation of bradykinin)
- Amines (e.g. removal of serotonin and noradrenaline)
- Synthesis of glycolipids (e.g. surfactant), proteins (collagen and elastin)
- Catabolic functions (removal of proteases, e.g. alpha-1-antitrypsin)
- Carbohydrate metabolism
- Metabolism of vasoactive substances
- Immune functions
- Physical filtration and removal of inhaled particles involving airway lining and mucociliary clearance, and airway reflexes (cough, sneeze)
- Immunological defence against inhaled particles involving tonsils alveolar macrophages.
- Secretion of immunoglobulin, primarily IgA, that is present in bronchial secretions.
- Acid-base balance
- Via excretion of carbon dioxide and thus indirectly altering H+ concentration via the Henderson-Hasselbalch equation
- Drug absorption
- Aerosolised inhaled drugs may rapidly pass into systemic circulation and have systemic effects (e.g. beta-agonists used as bronchodilators)
- Temperature regulation of the body
References
Levitzky, M. G. (2018). Chapter 1: Function and Structure of the Respiratory System. In Pulmonary physiology (9th ed). McGraw-Hill education.
Levitzky, M. G. (2018). Chapter 10: Non-respiratory Function of the Lung. In Pulmonary physiology (9th ed). McGraw-Hill education.
Joseph, D., Puttaswamy, R. K., & Krovvidi, H. (2013). Non-respiratory functions of the lung. Continuing Education in Anaesthesia Critical Care & Pain, 13(3), 98–102. https://doi.org/10.1093/bjaceaccp/mks060
Ventilation
Ventilation is a process of moving air in and out of the lungs. Ventilation can be considered in two ways: minute ventilation or alveolar ventilation.
Minute ventilation is the total volume of air that is inspired or expired per minute.
Minute ventilation=Tidal volume ×Respiratory rate
Alveolar ventilation is the total volume of inspired air that participates in gas exchange. In other words, it is the minute ventilation minus the dead space. In a healthy adult, around 150mL of air is in the conducting airway, and this air volume, also referred to as dead space, does not participate in gas exchange.
Alveolar ventilation=Tidal volume-Dead space volume×Respiratory rate
Lung volumes and capacities
As clinicians, we need to be aware of several lung volumes and capacities.
Lung volumes and their definitions:
- Tidal volume (TV): volume of air that is inspired or expired during normal resting breathing.
- Inspiratory reserve volume (IRV): additional volume of air that can be maximally inspired on top of normal tidal volume inspiration.
- Expiratory reserve volume (ERV): additional air volume that can be forcefully expired after normal tidal volume expiration.
- Residual volume (RV): volume of air remaining in the lung after maximal expiration.
Lung capacities are a combination of two or more lung volumes. Lung capacities and their definitions:
- Vital capacity (VC): air volume that can be maximally expired after maximum inspiration.
- VC = IRV + TV + ERV
- Functional residual capacity (FRC): volume of air remaining in the lung at the end of resting expiration.
- FRC = ERV + RV
- Total lung capacity (TLC): volume of air in the lung after maximal inspiration
- TLC = IRV + TV + ERV + RV
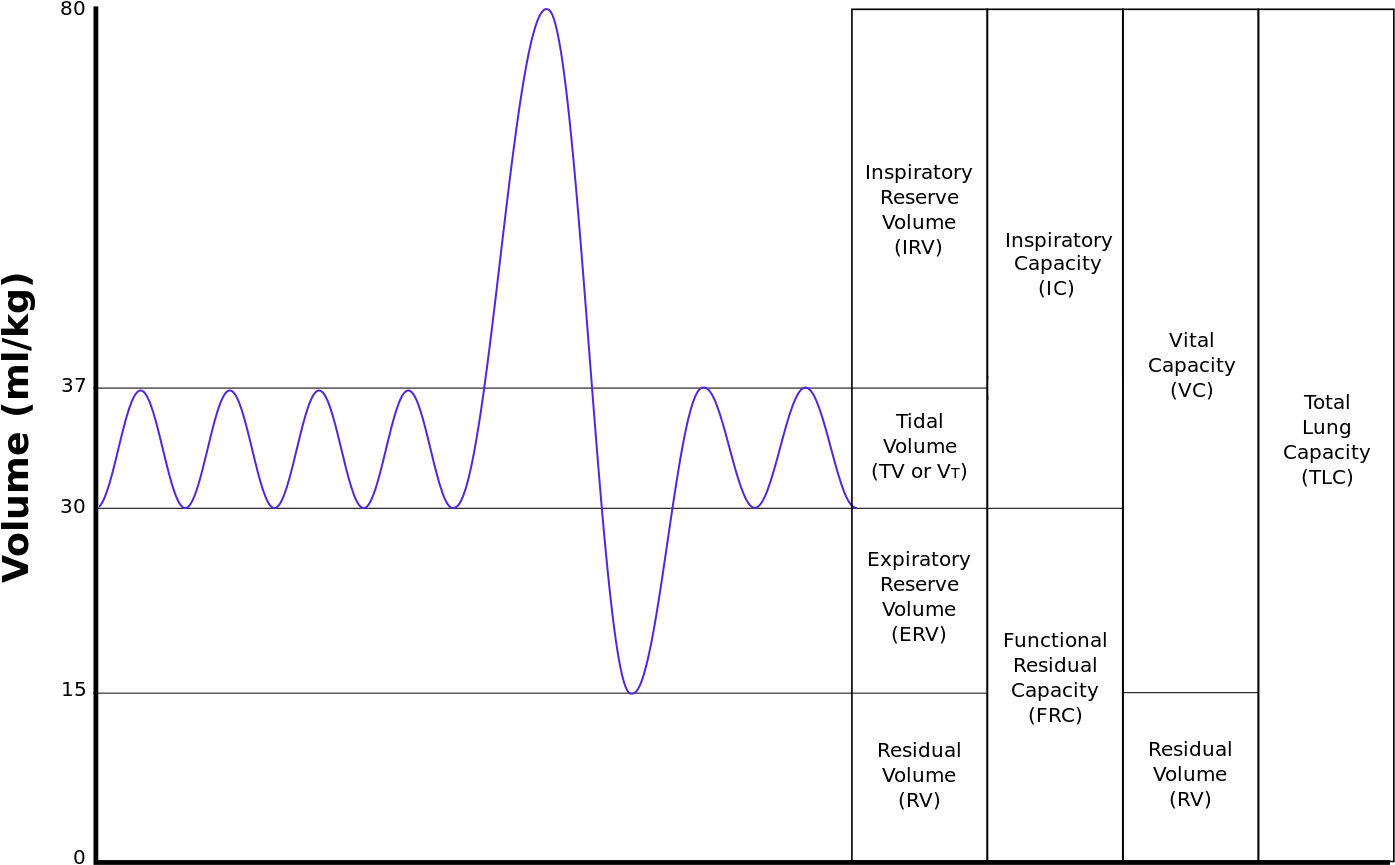
Image Source: Wikimedia Commons (2012). Lung Volumes Updated, Licensed under a creative commons licence. Available for free at: https://upload.wikimedia.org/wikipedia/commons/1/16/Lungvolumes_Updated.png (Accessed: 4 January 2024).
Other important measurements that can be obtained by the spirometry measurements include:
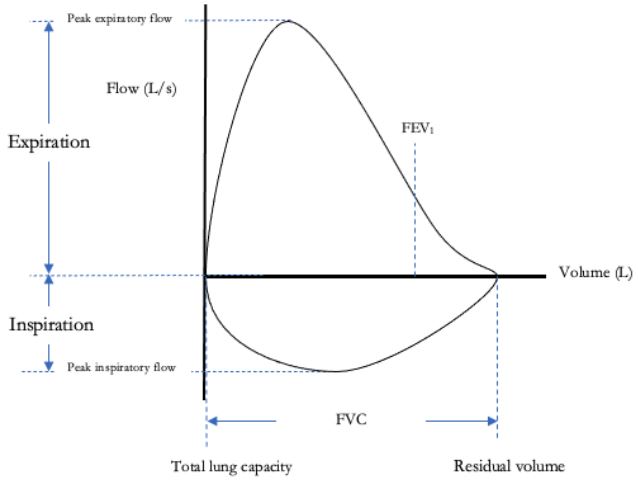
- Forced vital capacity: Volume of air that can be forcibly expired after maximal inhalation.
- FEV1: Air volume that can be forcibly expired during the first second of expiration after maximal inhalation.
This information can be summarised in a flow-volume loop. Changes in the contour of the loop can help support the diagnosis of restrictive or obstructive pulmonary conditions.
Measuring lung volumes
Methods to measure lung volumes include:
- Spirometry
- Body plethysmography
- Helium dilution technique
Spirometry cannot measure residual volume. As a result, we cannot measure functional residual volume and total lung capacity with spirometry. Residual volume can be measured using body plethysmography and helium dilution techniques.
The helium dilution technique may underestimate residual volume as it does not consider smaller airways behind an obstruction (i.e. gas trapping in COPD). Body plethysmography takes smaller airways behind obstruction into account. Hence, it is more accurate compared to the helium dilution technique.
Clinical relevance
Table of comparison of characteristics seen in pulmonary function tests in diseases
| Obstructive lung disease
(e.g. asthma, COPD, cystic fibrosis) |
Restrictive lung disease
(e.g. interstitial lung disease, neuromuscular disease, chest wall pathology) |
|
| Characteristics | ↑ airway resistance 🡪 ↓ air flow rates Air trapping Hyperinflation of lungs |
↓ lung compliance 🡪 ↓ lung volumes |
| FEV1/FVC ratio | ↓ | ↑ / normal |
| TLC | ↑ / normal | ↓ |
FEV1 can also be used in reversibility tests in the diagnosis of asthma.
Different patterns of flow-volume loops in different diseases.
Note: Flow-volume loop is produced by asking the person to fully inspire to total lung capacity from residual volume, then exhale as hard as possible back to residual volume
Normal
- The loop for the inspiratory limb is symmetric and convex.
- The expiratory limb is linear.
Restrictive disease (e.g. interstitial lung disease, neuromuscular disease, chest wall pathology)
- Narrower loop due to reduced forced vital capacity due to reduced lung compliance.
- Airflow is greater than normal during expiration at each lung volume due to increased elastic lung recoil.
Lower airway obstructive disease (e.g. asthma, emphysema)
- Airflow during expiration at all lung volumes is reduced due to increased airway resistance.
- The expiratory limb is prolonged.
Fixed upper airway obstruction (e.g. goitre, tracheal stenosis)
- Inspiratory and expiratory loops are flattened, resulting in a rectangular-looking loop. This is because fixed upper airway obstruction limits airflow during inspiration and expiration equally.
Variable extra thoracic obstruction (e.g. vocal cord paralysis, neoplasm in upper airway)
- The structures involved in pathology move according to pressure gradients across the glottis.
- Using vocal cords as an example:
- The vocal cord is drawn inwards during forced inspiration, resulting in increased airway resistance and flattening of the inspiratory limb.
- The vocal cord is pushed open during forced expiration. Hence, the expiratory limb has a normal shape.
Variable intrathoracic obstruction (e.g. tracheomalacia)
- Forced inspiration results in negative intrathoracic pressure that keeps the trachea open and patent. Hence, the normal shape of the inspiratory limb
- Forced expiration results in loss of the negative intrathoracic pressure, keeping the trachea open, narrowing the trachea and increasing airway resistance. Hence, the expiratory limb will have a flattened shape.

Pulmonary dynamics
Lung compliance
Compliance is defined as the unit change in volume per unit change in pressure. It is the inverse of elastance.
Compliance of the lung can be demonstrated using the compliance curve.

During inspiration, work is done to overcome (1) elastic recoil of the lungs and (2) resistance from airway and lung tissues sliding over each other. Work done to overcome the lung’s elastic recoil is stored as potential energy. This potential energy is released during expiration.
Hence, inspiration is active in normal, healthy patients, and expiration is passive.
This brings us to a discussion on work done during respiration.
Factors that alter compliance include (but are not limited to):
Increase compliance:
- Emphysema
- Increasing age (loss of pulmonary connective tissues)
Decrease compliance:
- Decreased lung compliance (pulmonary fibrosis, pulmonary oedema)
- Decreased chest wall compliance (obesity, burn to chest wall)
Work done during respiration.
Forgive this brief incorporation of physics. It will make sense, I promise. ( This will not be tested in the exam but will help understand the concepts below).
Work done = Pressure x Volume.
From the formula above, we can determine work done during respiration using the compliance curve.

Work done during inspiration = purple + red + green
Work done during expiration = red (to overcome airway resistance)
Purple = work done loss as heat energy
In lung diseases, the compliance curve changes, and work done changes as well.
In restrictive lung disease, lung compliance decreases, and the inspiratory limb curves downwards and rightwards. This increases work done during inspiration.
In obstructive lung disease (i.e. COPD), the expiratory limb curves leftwards and upwards. This may curve outside of the purple zone. This area represents the additional work needed for active expiration.

Airway resistance

Airway resistance is affected by:
- Airway radius
- Lung volumes
- Phase of respiration
- Autonomic activity
- Elastic recoil of the lung
- Local PaCO2
Although the airway becomes narrower towards the lung periphery, the peripheral airway contributes little airway resistance due to multiple parallel airways. The upper respiratory tract contributes 30-50% of total airway resistance in a healthy person. The large-to-medium-sized bronchi are the location along the lower respiratory tract that contributes the most resistance.
References
Levitzky, M. G. (2018). Chapter 3: Alveolar Ventilation. In Pulmonary physiology (9th ed). McGraw-Hill education.
David, S., & Edwards, C. W. (2022). Forced Expiratory Volume. In StatPearls. StatPearls Publishing. http://www.ncbi.nlm.nih.gov/books/NBK540970/
Moore, V. C. (2012). Spirometry: Step by step. Breathe, 8(3), 232–240. https://doi.org/10.1183/20734735.0021711
Ponce, M. C., & Sharma, S. (2022). Pulmonary Function Tests. In StatPearls. StatPearls Publishing. http://www.ncbi.nlm.nih.gov/books/NBK482339/
Levitzky, M. G. (2018). Chapter 2: Mechanics of Breathing. In Pulmonary physiology (9th ed). McGraw-Hill
Pulmonary circulation
Blood supply to the lung
The lung receives blood supply via bronchial circulation and pulmonary circulation.
Bronchial circulation carries oxygenated blood from the left ventricle and supplies part of the tracheobronchial tree. Bronchial arteries arise from the aorta and the intercostal arteries and drain into pulmonary veins.
Pulmonary circulation carries mixed venous blood from the right ventricle to the pulmonary capillaries, where it participates in gas exchange.
Pressures in the pulmonary circulation
Pulmonary circulation is a low-pressure system. Typical measurements within the main pulmonary artery are:
Mean arterial pressure = 15mmHg
Systolic blood pressure = 25mmHg
Diastolic blood pressure = 8mmHg
Hence, the pressure gradient across pulmonary circulation is around 7-10mmHg.
Pulmonary vascular resistance
To readers familiar with Physics, vascular resistance is analogous to electrical resistance.

Pulmonary vascular resistance is determined by using pressure differences across pulmonary circulation and blood flow rate through the pulmonary circulation.

Pulmonary vascular resistance is approximately one-tenth of the systemic vascular resistance.
References
Levitzky, M. G. (2018). Chapter 4: Blood Flow to the Lung. In Pulmonary physiology (9th ed). McGraw-Hill education.
Ventilation-perfusion relationship
Regional variations of ventilation and perfusion
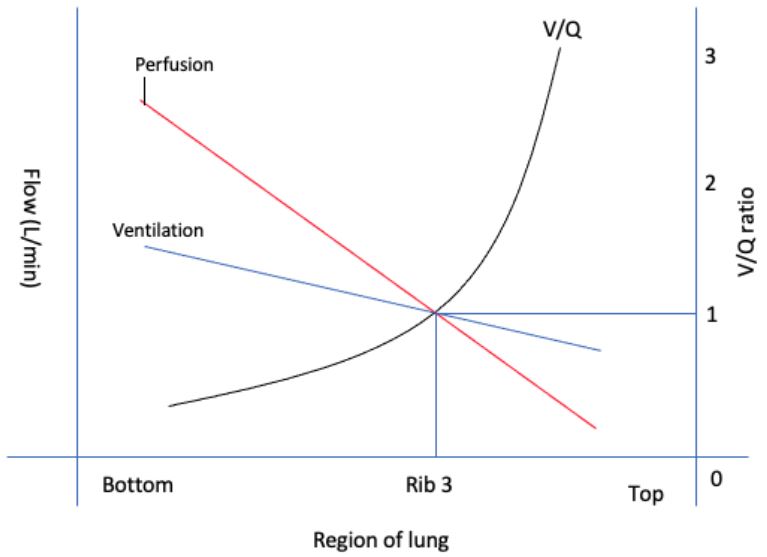
Consider a person standing upright; the upper lung zones (non-dependent areas) will be expanded at rest compared to the lower lung zones (dependent areas). During inspiration, the upper lung zones will increase in size to a lesser degree than the lower lung zones. Hence, ventilation of the upper lung zone is less compared to the lower lung zone.
Perfusion of the upper lung zone will be less than the lower lung zone due to the effect of gravity. However, the increase in perfusion is more significant than the increase in ventilation as we move from upper to lower lung zones. The overall V/Q ratio of a normal lung is 0.9.
West’s zones
Dead space and shunt
When considering ventilation and perfusion of the lung, ventilation-perfusion ratio, dead space, and shunt come to everyone’s mind.
First, some definitions:
Dead space is the volume of inspired air that does not participate in gas exchange. In terms of the V/Q ratio, this translates to V of 1, Q of 0, and V/Q ratio of ∞.
A shunt is a volume of blood that enters systemic circulation without participating in gas exchange. In terms of the V/Q ratio, this translates to V of 0 and Q of 1. Hence V/Q ratio would be 0.
Dead space and shunt can be considered the opposite extremes of the V/Q ratio.
The normal V/Q ratio is around 0.8.
Dead space
Dead space is then classified further into anatomical and alveolar dead space.
Anatomical dead space = volume of air in the conducting airway.
Alveolar dead space = volume of air in the alveoli that is not perfused.
Physiological dead space = anatomical dead space + alveolar dead space.
Factors that will increase dead space include:
- Bronchodilation
- Pulmonary emboli (blood/air)
- Hypovolaemia/Hypotension
Shunt
Shunt can be classified as intrapulmonary shunt and anatomical shunt.
Intrapulmonary shunts include:
- Physiological hypoxic pulmonary vasoconstriction
- Pathological factors (e.g. consolidation in chest infection)
Anatomical shunts include:
- Physiological: Thebesian veins, bronchial vein
- Pathological: cardiac anomalies resulting in R-L shunt (e.g. ventricular septal defect)
References
Levitzky, M. G. (2018). Chapter 5: Ventilation-Perfusion Relationships. In Pulmonary physiology (9th ed). McGraw-Hill education.
Gas exchange
The partial pressure of gas
Dalton’s law of partial pressure states that the pressure exerted by an individual gas in a gas mixture equals the pressure the individual gas will exert alone.
Gas diffusion
Gas exchange is affected by a few factors,
- Gas
- Solubility
- Molecular mass
- Concentration gradient
- Surface area
- Distance to travel during diffusion
Oxygen and carbon dioxide are exchanged between pulmonary circulation and alveoli.

Image Source: Wikimedia Commons (2018). Cross section of an alveolus and capillaries showing diffusion of gases, Licensed under a creative commons licence. Available for free at: https://upload.wikimedia.org/wikipedia/commons/1/13/Cross_section_of_an_alveolus_and_capillaries_showing_diffusion_of_gases.svg (Accessed: 4 January 2024).
Diffusing capacity or transfer factor of the lung
The diffusing capacity of the lung for carbon monoxide (DLCO) is a measurement of the lung’s ability to transfer gases. It is alternatively called the transfer factor of the lung (TLCO) – and uses different units.
Carbon monoxide is the only gas used for this test as it is diffusion-limited. Here is why. Carbon monoxide has a 250 times greater affinity for Hb than oxygen. Hence, CO is rapidly bound to Hb, resulting in low plasma partial pressure of CO. There will still be a partial pressure difference between alveolar CO and plasma CO at the pulmonary end of capillary blood.
DLCO or TLCO is commonly done during pulmonary function tests. It is done by measuring the partial pressure of CO-inspired and expired. The difference between inspired and expired CO is the amount of CO that has diffused across the alveolar-capillary barrier.
Causes that decrease DLCO:
- Pulmonary fibrosis
- Pneumonia
- Pulmonary hypertension
- Chronic pulmonary emboli
- Emphysema
- Congestive cardiac failure
Causes that increase DLCO:
- Asthma
- Left-to-right shunts
- Pulmonary haemorrhage
Note: Haemoglobin count (anaemia/polycythaemia) affects DLCO. Hence, DLCO is adjusted for Hb values.
References
Diffusing Capacity. (n.d.). Retrieved Jun 7 2022, from https://fpnotebook.com/lung/lab/DfsngCpcty.htm.
Modi, P., & Cascella, M. (2022). Diffusing Capacity Of The Lungs For Carbon Monoxide. In StatPearls. StatPearls Publishing. http://www.ncbi.nlm.nih.gov/books/NBK556149/
Levitzky, M. G. (2018). Chapter 6: Diffusion of Gases and Interpretation of Pulmonary Function Tests. In Pulmonary physiology (9th ed). McGraw-Hill education.
Delivery and transport of oxygen and carbon dioxide
Oxygen
Oxygen is carried in the blood via two methods:
- Bound to haemoglobin (98%)
- Dissolve in blood (2%)
This is reflected in the following formula:
Oxygen content in blood (mL of oxygen/100mL blood) = [1.34 x SpO2 x Hb (g/L)] +[0.023 x PaO2 (kPa)]
Delivery of oxygen is dependent on cardiac output.
Delivery of oxygen = Cardiac output x oxygen content in blood
Carbon dioxide
Carbon dioxide is carried in blood in various forms:
- Bicarbonate ion (HCO3-) (90%)
- Carbonic anhydrase enzymes found in abundance in red blood cell (RBC) cytoplasm catalyse the reaction CO2 + H2O ⇋ H2CO3 ⇋ H+ + HCO3-
- H+ cannot cross the RBC membrane. H+ binds to Hb, forming HHb.
- HCO3- in RBC is transported out of the cell down its electrochemical gradient in exchange with plasma Cl- to maintain the electrical neutrality of the cell. This process is referred to as ‘chloride shift.’
- Carbaminohaemoglobin (5%)
- CO2 binds to haemoglobin to form carbaminohaemoglobin (do not confuse this with carboxyhaemoglobin, COHb, which is carbon monoxide bound to Hb)
- Deoxyhaemoglobin binds more readily to carbon dioxide (Haldane effect)
- Dissolved as carbonic acid in plasma (5%)
References
Levitzky, M. G. (2018). Chapter 7: Transport of Oxygen and Carbon Dioxide in the Blood. In Pulmonary physiology (9th ed). McGraw-Hill education.
Oxygen-haemoglobin dissociation curve
The oxygen-haemoglobin dissociation curve describes the relationship between the percentage saturation of haemoglobin and the partial pressure of oxygen in the blood.
Summary
Normal curve

Image Source: Oregon State Education (2017). 22-5-transport-of-gases, Licensed under a creative commons licence. Available for free at: https://open.oregonstate.education/aandp/chapter/22-5-transport-of-gases/(Accessed: 9 January 2024).
Things to note:
- Arterial blood: SpO2 is 100%, PaO2 is 13.3kPa
- Mixed venous blood: SpO2 is 75%, PaO2 is 5.3kPa
- P50: SpO2 at 50%, PaO2 is 3.5kPa
P50 is the partial pressure of oxygen when SpO2 is at 50%. This is used to compare the oxygen-haemoglobin dissociation curve in different situations. We will discuss this next.
Shifting the curve to the right
When the oxygen-haemoglobin dissociation curve is shifted to the right, the affinity of haemoglobin to oxygen is reduced. Oxyhaemoglobin has a higher tendency to unload oxygen.
Factors that shift the oxygen-haemoglobin dissociation curve to the right include:
- Increased 2-3 diphosphoglycerate (produced during metabolism)
- Acidosis
- Increased pCO2
- Increased temperature
Shifting curve to the left
When the oxygen-haemoglobin dissociation curve is shifted to the left, the affinity of haemoglobin to oxygen is increased.
Factors that shift the oxygen-haemoglobin dissociation curve to the left include:
- Hypothermia
- Alkalosis
- Decrease pCO2.
- Foetal Hb
- MetHb
- COHb

Image Source: Wikimedia Commons (2006). Oxyhaemoglobin dissociation curve, Licensed under a creative commons licence. https://upload.wikimedia.org/wikipedia/commons/8/8a/Oxyhaemoglobin_dissociation_curve.png (Accessed: 4 January 2024).
Bohr effect
The Bohr effect describes the shift in the position of the oxygen-haemoglobin dissociation curve at different partial pressures of CO2. The increased partial pressure of CO2 shifts the oxygen-haemoglobin dissociation curve to the right and increases the unloading of O2 by oxyhaemoglobin. This is attributed to the effect of changes in pCO2 to H+ concentration.
Haldane effect
The Haldane effect describes the increased ability of deoxyhaemoglobin to carry CO2 compared to oxyhaemoglobin.
References
Levitzky, M. G. (2018). Chapter 7: Transport of Oxygen and Carbon Dioxide in the Blood. In Pulmonary physiology (9th ed). McGraw-Hill education.
Control of breathing
The control of breathing can be considered into separate components: receptors, controllers, and effectors.
Receptors
Receptors responsible for the control of breathing can be categorised into:
- Central chemoreceptors
- Peripheral chemoreceptors
- Other receptors
Central chemoreceptors
Central chemoreceptors are in the anterolateral surface of the medulla within the blood-brain barrier. It directly detects changes in hydrogen concentration (and, in effect, the changes in pH) in the cerebrospinal fluid (CSF). Indirectly, central chemoreceptors detect changes to blood CO2 concentration.
CO2 in the blood can pass the blood-brain barrier. After passing the blood-brain barrier into CSF, it reacts to eventually produce hydrogen ions (H+) and bicarbonate ions (HCO3-). H+ diffuses into chemoreceptor cells, directly stimulating chemoreceptor cells. Stimulation of chemoreceptor cells will then activate the respiratory centre.
H+ ions in the blood cannot pass the blood-brain barrier. Hence, respiratory acidosis will stimulate central chemoreceptors, and metabolic acidosis will not.
Compensation in hypercapnia – long-standing hypercapnia will result in compensation in the CSF and intravascular space. Long-standing hypercapnia will result in HCO3- being absorbed into CSF space to normalise pH and reabsorption of HCO3- by the kidneys.
Peripheral chemoreceptors
Peripheral chemoreceptors are in the carotid bodies and aortic bodies. Both carotid and aortic bodies respond to changes in partial pressure of carbon dioxide (PaCO2)and partial pressure of oxygen (PaO2) [not oxygen content in the blood]. However, peripheral chemoreceptors are only responsible for 20% of the body’s response to high PaCO2. Central chemoreceptors are responsible for the rest.
Carotid chemoreceptors are also stimulated by increased blood hydrogen centration (decrease in blood pH). This is the reason for hyperventilation in metabolic acidosis.
Carotid bodies send afferent signals to the respiratory centre via the glossopharyngeal nerve (CN IX)
Aortic bodies send afferent signals to the respiratory centre via the vagus nerve (CN X)
Other receptors
- Lung stretch receptors – located in bronchial smooth muscles, part of the Hering-Bruer reflex. The Hering-Bruer reflex is a reflex where overinflation of the lung (i.e. during positive pressure ventilation) causes stimulation of lung stretch receptors. Lung stretch receptors send afferent signals via the vagus nerve (CN X) to the apneustic centre, causing a reduction in the depth of breathing.
- Juxtacapillary receptors (J receptors) – These are unmyelinated C-fibres in the alveolar wall. Stimulation of these receptors leads to increased ventilation, dyspnoea, bradycardia and hypotension. These receptors are thought to be stimulated in pulmonary oedema and pulmonary embolism.
- Laryngeal epithelial irritant receptors – irritants (i.e. noxious gas) stimulate receptors, causing bronchoconstriction and increasing ventilation.
Controller
The controller of respiration is made up of a group of nuclei found throughout the brainstem. They can be considered into different groups:
- Dorsal respiratory group
- Controls diaphragmatic contraction.
- Responsible for everyday tidal volume inspiration
- Ventral respiratory group
- Controls intercostal muscles.
- Responsible for forced expiration and increased force in inspiration
- It contains the pre-Botzinger complex, thought to be the respiratory pacemaker.
- Controls intercostal muscles.
- Pneumotaxic centre
- Fine-tunes respiratory pattern
- It can increase respiratory rate.
- Apneustic centre
- Prevents over-expansion of the lung (as part of the Hering-Bruer reflex – see ‘Receptors’)
Effectors
- Diaphragm
- Responsible for 75% of volume changes in resting inspiration
- Innervated by phrenic nerve (C3,4,5)
- Intercostal muscles
- External – inspiration
- Internal – expiration
- Accessory muscles
- Include sternocleidomastoid muscles, strap muscles of the neck, and platysma.
- Used during respiratory distress, forced expiration.
Effect of PaCO2 and PaO2 on ventilation
PaO2
This can be represented by the graph below.

First, look at the line with normocapnia. Minute ventilation (MV) is unchanged when PaO2 is above 8kPa. When PaO2 falls below 8kPa, there is a steep rise in MV.
Now, compare the lines between normocapnia and hypercapnia. A rise in PaCO2 will also stimulate the chemoreceptors (both central and peripheral). Hence, the line is shifted rightwards and upwards, representing higher MV for every PaO2.
PaCO2
This can again be represented in the graph below:
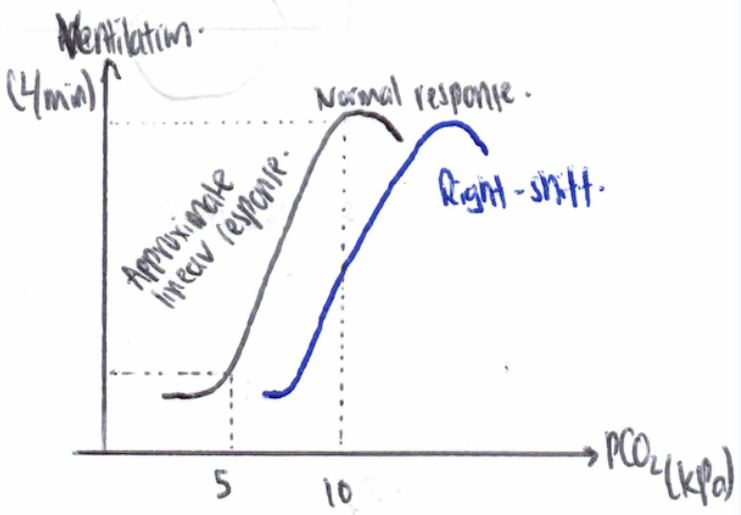
First, consider the left curve. MV will remain relatively the same below PaCO2 of 5kPa. With PaCO2 above 5kPa, there is a linear rise in MV up to approximately 11-12kPa. Above 11-12kPa, MV starts falling off due to hypercapnic respiratory depression.
A rightward shift of the line can occur in a few situations (i.e., use of opioids – blunting response to rise in PaCO2, COPD – chronic hypercapnia)
References
Levitzky, M. G. (2018). Chapter 9: Control of Breathing. In Pulmonary physiology (9th ed). McGraw-Hill education.
Complete Guide to Clinical Genetics ST3 Application and Recruitment (2027)
Written by Medibuddy. Last updated: October 2026. Clinical Genetics is

Complete Guide to Clinical Radiology ST3 Application and Recruitment (2027)
Recruitment paused: NHS England is not running Clinical Radiology ST3+ recru

Complete Guide to Paediatric Surgery ST3 Application and Recruitment in United Kingdom (2026)
Written by Medibuddy. Last updated: October 2026. If you’re planning


Take your subscriptions with you
Our mobile app allows you to access your interview and exam question banks wherever you are.