Close
Close
 7th February 2024
Effect of PaCO2 and PaO2 on ventilation
PaO2
This can be represented by the graph below.

First, look at the line with normocapnia. Minute ventilation (MV) is unchanged when PaO2 is above 8kPa. When PaO2 falls below 8kPa, there is a steep rise in MV.
Now, compare the lines between normocapnia and hypercapnia. A rise in PaCO2 will also stimulate the chemoreceptors (both central and peripheral). Hence, the line is shifted rightwards and upwards, representing higher MV for every PaO2.
PaCO2
This can again be represented in the graph below:
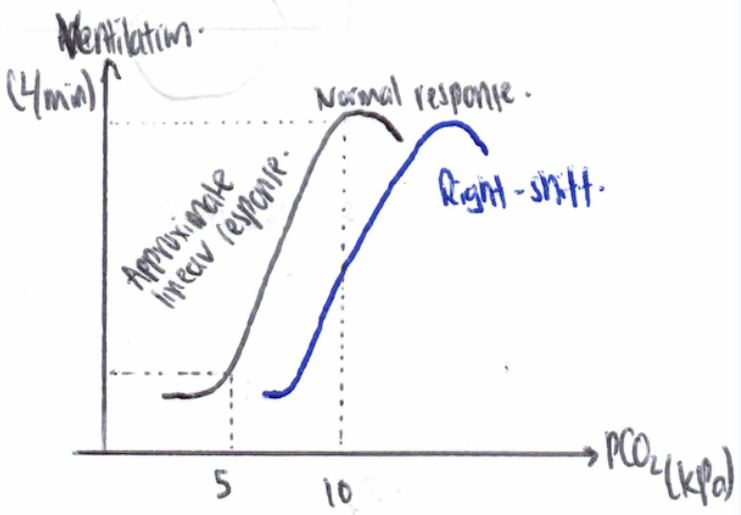
First, consider the left curve. MV will remain relatively the same below PaCO2 of 5kPa. With PaCO2 above 5kPa, there is a linear rise in MV up to approximately 11-12kPa. Above 11-12kPa, MV starts falling off due to hypercapnic respiratory depression.
A rightward shift of the line can occur in a few situations (i.e., use of opioids – blunting response to rise in PaCO2, COPD – chronic hypercapnia)
Complete Guide to Clinical Genetics ST3 Application and Recruitment (2027)
Written by Medibuddy. Last updated: October 2026. Clinical Genetics is

Complete Guide to Clinical Radiology ST3 Application and Recruitment (2027)
Recruitment paused: NHS England is not running Clinical Radiology ST3+ recru

Complete Guide to Paediatric Surgery ST3 Application and Recruitment in United Kingdom (2026)
Written by Medibuddy. Last updated: October 2026. If you’re planning


Take your subscriptions with you
Our mobile app allows you to access your interview and exam question banks wherever you are.